OVBC JULY – AUGUST 2023
BENCHMARKING OREGON’S SOCIAL AND POLITICAL CLIMATE
OREGONIANS BY THE NUMBERS AND IN THEIR OWN WORDS
KEY FINDINGS
INTRODUCTION
From August 4-11, 2023, the Oregon Values and Beliefs Center conducted opinion research about Oregon’s current social and political climate, which benchmarked previous studies conducted in December 2020[1], September 2021[2], January 2022[3], April 2022[4], and September 2022[5]. This memo summarizes key findings.
The question numbers in this document correspond with the accompanying annotated questionnaire and tabs. Due to rounding, the percentages reported below may not add up to 100% or compare exactly to the percentages for the same question in the annotated questionnaire or tabs.
Included below for selected questions are noteworthy subgroup variations for age, gender, area of the state, BIPOC/white, etc. The accompanying set of tabs notes subgroup variations for all the questions.
OVBC surveys currently use aggregated data to analyze the opinions of BIPOC residents in comparison to the opinions of residents who identify as white and not another race. BIPOC residents are not a monolith; the grouping represents a wide diversity of races and ethnicities. The findings included in this memo should not be construed such that all people of color are believed to share the same opinions. Disaggregated race data will be provided when sample sizes permit reliability.
For survey full question wording, all statistically significant subgroup findings, and respondent quotes, readers are encouraged to refer to the accompanying documents: (1) annotated questionnaire, (2) crosstabulations, and (3) verbatim written responses spreadsheet (upon request). ATTACHED
Oregon Values and Beliefs Center (OVBC): This research was completed as a community service by the Oregon Values and Beliefs Center. OVBC is an independent and non-partisan organization and an Oregon charitable nonprofit corporation. Representative OVBC projects include opinion research about race-based crimes for the Asian Health and Service Center, as well as research about early childhood education and the cost of childcare for the Children’s Institute.
OREGONIANS SPLIT ON STATE’S DIRECTION
- Oregonians remain divided in the direction of our state, with a slight plurality saying we are off on the wrong track (46%) instead of heading in the right direction (45%) (Q1).
- Oregonians 75 and older (54%), college graduates (54%), and those living in urban areas (52%) are more likely than their peers to say things are headed in the right direction.
GRAPH ATTACHED – Q1 GRAPH
- Of those who think Oregon is headed in the right direction, most only somewhat agree (38%) compared to a handful who strongly believe (7%) Oregon is headed in the right direction.
- Among those who say the state is off on the wrong track, 22% believe it is only somewhat off, while 24% feel Oregon is strongly off on the wrong track.
- The percentage of respondents who strongly feel Oregon is on the wrong track has significantly decreased since the most recent benchmark survey in September 20225. This decline breaks the trend of a 1% increase in the “wrong track, strongly” response for each previous benchmark survey.
- The 2023 survey produced the closest split between those who selected “wrong track” and “right direction” since September 20212, when 49% of Oregonians selected “wrong track” and 45% chose “right direction.”
UNITED IN WORRIES ABOUT THE FUTURE OF THEIR AREA OF OREGON
- While Oregonians diverge when asked about the direction of the state, they are much more united in their worry about the future of their area of Oregon. 73% say they are somewhat (43%) or very (30%) worried. A mere 4% say they are not at all worried, and 20% say they are not too worried, totaling 24% who are not worried (Q2).
GRAPH ATTACHED – Q2 GRAPH
- Overall, the percentage of those who say they are worried is nearly identical to when we asked Oregonians the same question in 2022.
- As in previous years, a considerable majority of men and women are concerned about the future, although women (78%) are more likely to say they are worried than men (67%).
- Those aged 55-64 are more likely than their peers to say they are worried (78%), while respondents aged 18-29 and 75 and over are less likely to (67%, 66%).
- Once again, political ideology correlates with the level of worry. Republicans (84%) and those who identify as economically or socially conservative (82%, 84%) are more worried about the future than Democrats (69%) and economic and social liberals (68%,67%). People not registered with one of the two major parties (73%) or who identify as economically or socially moderate (71%,73%) fall somewhere in between.
- An OVBC September 2022 survey found similar results when looking at the breakdown between political ideologies.
WELL-BEING: MANY OREGONIANS REPORT NOT DOING WELL
After gauging how Oregonians feel about the future, we asked how they were currently doing and feeling considering everything that has happened to their area of Oregon in the past ten years (Q5-8).
Economic Well-Being
GRAPH ATTACHED – Q5 AND 7 GRAPH
- A little more than half of Oregonians feel they are being left behind economically (54%). In response to a validation question, a lesser but significant percentage (45%) disagree that they are doing well economically.
- Those who are more likely to say they are not doing well include people aged between 18-44 years, those with some college education or less, and people of color.
- Unsurprisingly, respondents who are most likely to say they feel left behind and not doing well economically are renters and those in the lowest income bracket.
- People who are more likely to say they do not feel left behind and are doing well economically include people aged 65 and older and college graduates.
- Men (57%) were significantly more likely than women (48%) to say they are doing well economically.
- Those who are more likely to say they are not doing well include people aged between 18-44 years, those with some college education or less, and people of color.
Social Well-Being
GRAPH ATTACHED – Q6 AND 8 GRAPH
- A narrow majority of Oregonians feel very connected to and happy with their communities (55%), with 41% disagreeing with the statement. A similar validation question shows 46% disagreeing that they feel socially disconnected or left out from their communities and 48% agreeing.
- Those who are more likely to say they feel left out or socially disconnected are similar to the groups more likely to report economic hardship. Those between the ages of 18-44 years, people whose education includes high school or less, and people of color all feel more socially disconnected than their peers.
- Renters and those in the lowest-income bracket were more likely than their peers to feel social disconnection in their communities.
- Again, groups inclined to say they are happy and connected to their communities coincide with those who felt they were doing well economically, such as respondents aged 65 and older and college graduates.
- People living in rural areas are also more likely than their peers to feel a strong community connection.
- Those who are more likely to say they feel left out or socially disconnected are similar to the groups more likely to report economic hardship. Those between the ages of 18-44 years, people whose education includes high school or less, and people of color all feel more socially disconnected than their peers.
Well-Being: Central Oregon vs. Statewide
- From October 19-November 28, 2022, the Oregon Values and Beliefs Center, in partnership with the Central Oregon Intergovernmental Council (COIC) conducted a survey of central Oregonians’ values and beliefs to assist COIC with planning, policymaking, and communications. The survey’s questionnaire included the above four questions about well-being.
- Economically, Central Oregon residents feel better off than their state counterparts with 47% disagreeing that they feel they’re being left behind compared to 40% statewide
GRAPH ATTACHED – Q5 COMPARISON GRAPH
- Central Oregonians also report feeling better socially than their statewide counterparts. A majority (56%) disagree that they feel left out or disconnected from their community, compared to 46% statewide. Similarly, 66% feel very connected to and happy about their community compared to 55% statewide.
GRAPH ATTACHED – Q6 AND 8 COMPARISON GRAPH
MOST IMPORTANT ISSUE: HOMELESSNESS AGAIN TOPS THE LIST
- Respondents were given the opportunity to share, in their own words, the most important issue they wanted their elected leaders to address (Q3).
- From this list, four tiers of issues emerged:
- Tier 1: Houselessness
- Tier 2: Substance Use/Abuse, Housing, Crime
- Tier 3: Political Climate, Climate Change, Criminal Justice Reform, Economic Equality
- Tier 4: Response themes below 5%
- A complete listing of verbatim responses sortable by key demographic variables is available upon request.
GRAPH ATTACHED – Q3 GRAPH
Tier 1: Homelessness
- Homelessness is the top-tier issue by far and is cited as the most important issue by every single demographic group (31-51%).
- Little has changed in the past year, as previous September 20225 (37%) and April 20224 surveys (35%) also found homelessness to be the number one issue Oregonians want addressed.
- Tri-County residents are especially likely to say homelessness is the most important to address (53%), compared to Willamette Valley residents (42%) and other parts of the state (35%). Since September 2022, these percentages have increased by six percentage points each.
Tier 2: Substance Use/Abuse, Housing, Crime
- The second tier is comprised of the second, third, and fourth-most mentioned issues: substance use and abuse (16%), housing supply and affordability (15%), and crime (12%).
- Substance use/abuse was mentioned more often by those who live in the Tri-County area (18%) than those in the Willamette Valley (9%) or the rest of the state (8%). Those less likely to mention substance abuse include people aged 75 or older (9%) and those living in rural areas (11%).
- Our demographic results for this question were reminiscent of a previous survey in September of 2022. Women mention housing more often than men (2023: 18% vs.12%; 2022: 17% vs. 12%). Renters are more concerned about housing than homeowners (2023: 19% vs. 14%; 2022: 18% vs. 11%). People who graduated college (2023: 20%, 2022: 17%) are more likely to mention housing than those with some college or less (2023:13%, 2022: 11%).
- People living in the Tri-County area are more likely to mention crime (18%).
Tier 3: Political Climate, Climate Change, Criminal Justice Reform, and Economic Equality
- A third tier contains the fifth through eighth most cited issues: political climate (7%), climate change, criminal justice reform, and economic equality (5%, each).
- Respondents who are homeowners (10%), those with some college or more (8-9%), and men (9%) mention civic and political climate as an issue more often than renters (4%), those with a high school education or less (4%), and women (5%). People between the ages of 55-74 (10-13%) are more likely than other age groups to report civic and political climate as an issue, while those in urban areas (4%) are less likely.
- Oregonians aged 75 and older (11%) and those with a four-year degree (9%) are more likely to mention climate change.
Tier 4: Other Issues
- Oregonians mentioned twenty-eight other issues that were each mentioned by less than 5% of the survey respondents, including education and schools, social services, taxes, infrastructure, and healthcare. Additional findings can be found in the crosstabulations.
COMMON GROUND: SHARED VALUES DESPITE THE DIVIDES
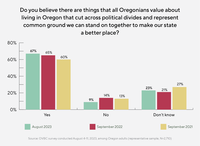
GRAPH ATTACHED – Q4 GRAPH
- Even though Oregonians are split about the state’s direction; fare differently socially and economically; and offer up an abundance of challenges that need addressing, most respondents are hopeful. Oregonians believe there are things that we all value that cut across political divides, representing the common ground we can stand on together to make our state a better place (67%). 23% aren’t sure, and only about one in ten (9%) don’t believe there are things all Oregonians value that can bring us together (Q4).
- These findings are reminiscent of previous results from the OVBC September 20225 and 20212 surveys, with a slight decrease in those who don’t think we have shared values that can cut across divides (13% in 2021; 14% in 2022; 9% in 2023).
- Across all demographic groups, a majority believe there are commonalities we can build on.
- Those with school-aged children (74%), people with a higher annual income ($100K+:73%), and those with some college or a 4-year degree (68-73%) are especially likely to agree. These results reflect previous findings in the OVBC September 2022 survey.
SUMMATION QUOTES
Amaury Vogel, Associate Executive Director:
- “About equal numbers of Oregonians feel the state is headed in the right direction as feel it is off on the wrong track. Maybe some good news is that the number of Oregonians who strongly feel Oregon is off on the wrong track has decreased compared to past surveys going back to 2020.”
- “While Oregonians are divided about which direction the state is headed, they are united in their worry about the future of their area of Oregon.”
- “A narrow majority of Oregonians report feeling left behind economically, and a plurality disconnected from their communities.”
- “Homelessness is the biggest blip on the radar screen for Oregonians. It continues to be the most important issue for every single demographic group.”
- “The four most important issues Oregonians would like to see their elected local leaders do something about are homelessness at 44% followed distantly by a next tier of “drugs, addiction, substance use and abuse,” “housing supply, affordability, rent control,” and “crime,” all between 12% and 16%.”
- “Despite feeling negative about their area of the state, Oregonians are hopeful believing there are things we all value that represent the common ground we can stand on together to make our state a better place.”
Research Methodology:
The online survey consisted of 2,710 Oregon residents ages 18+ and took approximately 15 minutes to complete. Respondents were contacted by using professionally maintained online panels. In gathering responses, a variety of quality control measures were employed, including questionnaire pre-testing, validation, and real-time monitoring of responses. To ensure a representative sample, demographic quotas were set, and the data was weighted by area of the state, gender, age, and education.
Statement of Limitations: Based on a 95% confidence interval, this survey’s margin of error for the full sample is ±1.88%. Due to rounding or multiple-answer questions, response percentages may not add up to 100%.
Respondents were given the opportunity to include their contact information if they are willing to speak to a journalist about their answers or their participation in the survey. A version of the verbatims with that information included is available upon request. – We want you to be able to use this resource, but we also want to protect the confidentiality of our respondents –
[1] Survey conducted December 4-8, 2020; DHM and OVBC; N=615; Q27
[2] Survey conducted September 14-22, 2021; OVBC; N=1,124; Q1, 46
[3] Survey conducted January 13-20, 2022; OVBC; N=1,400; Q9
[4] Survey conducted April 8-14, 2022; OVBC; N=1,581; Q1-2
[5] Survey conducted September 13-21, 2022; OVBC; N=1,878; Q1-3, 10